Infographics are a great way to share your scientific story!
Us humans are a visual species – we have been using illustration to tell our stories for thousands of years. So it makes sense that visualization would be an effective strategy to share our (often complex) scientific stories. Infographics are especially great at using visual elements to capture the attention of our audiences!
To train the skill of combining Art with Science to share more engaging stories, Lifeology is challenging you to Create your own Science Art Infographic this month!
But if you’re thinking about creating an infographic for this challenge, your first question may be: “Where do I start?“
First, check out the blog post & infographic we shared to introduce the challenge:
But if you still have questions about how to create an engaging infographic, keep reading!
In a live discussion hosted on our Slack Workspace, we crowdsourced advice on creating an engaging infographic from our resident experts! We asked our community the question of “Where do I start?”, along with many others. You can read the advice they gave toward Lifeology’s June SciComm Challenge below.
Questions:
Q. What are the strengths of an infographic for communicating science?
Q. What is your advice for the aspect ratio of an infographic?
Q. Can you share an example of a great infographic you’ve seen recently?
Q. How do you know when your infographic has too much or not enough information?
Q. What are any ‘gimmicks’ to avoid?
Q. How do you START with making an infographic? What is the first step?
Q. How do you decide what forms of data visualizations to use?
Q. How do you choose a color palette?
Q. Do you need formal training to create an infographic?
Q. Do you have a preferred illustration style for infographics?
Q: Which software do you recommend to create infographics?
Q. What are the strengths of an infographic for communicating science? What does an effective infographic look like?
Gaius Augustus: Infographics are a great way to share stories with one main idea, and can be visualized well with static imagery. I have written a blog post on the Anatomy of an Infographic. Echo Rivera has some fantastic info on design skills on her website, and I have another post that just goes over the highlights of design skills.
Shelley Hollingsworth: The strength of an infographic is that it is something visual rather than a lot of text, so people will be drawn to look at it. It needs to be appealing to look at and have pared-down wording. A key reason to go to the effort of creating an infographic is that you will reach people who would otherwise skip on to the next article.
Matthew Griffiths: I think it’s about visualization. Data is so much more meaningful if you can see it and it’s not just numbers on a page. Infographics add a whole new layer to the information and make it easier to digest (when done well).
I agree with Gaius about keeping it simple though! Good infographics have good visualization – something that is relevant to the data (think of using trees to make a graph on deforestation for example). They are simple and have a focus on one core message – which leads into flow of information. Your audience should easily be able to know what the point is and follow the flow of information.
A good question to ask yourself is, what is the infographic (visualization) ADDING to the data?

Q. What is your advice for the aspect ratio of an infographic?
Gaius Augustus: Before starting an infographic, I think it’s important to decide where it’s going to go. Social media? A print magazine? A flyer? Choose that first, then find the right size. I have a blog post with some more info on this.
I also want to mention that it’s often difficult to make an infographic that fits multiple methods. Like… Twitter and Instagram aspect ratios for images are different! But some quick notes. For the web, create images that are 72dpi resolution. I tend to like to make general images no more than 960 pixels wide, but it completely depends on the platform! For print, choose a higher resolution, at least 300dpi. Multiply the number of inches times this number to get the number of pixels (1 in * 300dpi = 300 pixels). Make sure you adjust your text size so that it’s easy to read! This is a common problem I see.
Matthew Griffiths: Yes your output (print, phone, etc) is important but also think about the subject matter and how you want the viewer to read through it. You can guide the audience’s eye by having the biggest boldest text at the start point for example. There also might be innovative ways you haven’t thought of – for example a timeline doesn’t have to be a long line from left to right. It could also be a circle divided up into units.
Nigel Hawtin: Infographics have been around for hundreds of years and so originally they would have been made for print. But yes, think about the medium and design for that medium or mediums. If more than one, then the graphic may have to change to accommodate portrait, landscape, desktop and print!
Pooja Gupta: If you don’t have the luxury of time to format it for each platform, I think keeping them to a square fits most social media platforms!

Q. Can you share an example of a great infographic that you’ve seen recently?
Gaius Augustus: Did y’all see the infographic Matthew Griffiths made for this challenge?!?!
Matthew Griffiths: Thanks! I really love infographics that take complex information and make it understandable, simplifying it and making it more digestible. To me that’s when an infographic is doing a good job. (I also love infographics about space for no particular reason.)
https://www.behance.net/gallery/10901127/History-of-Life
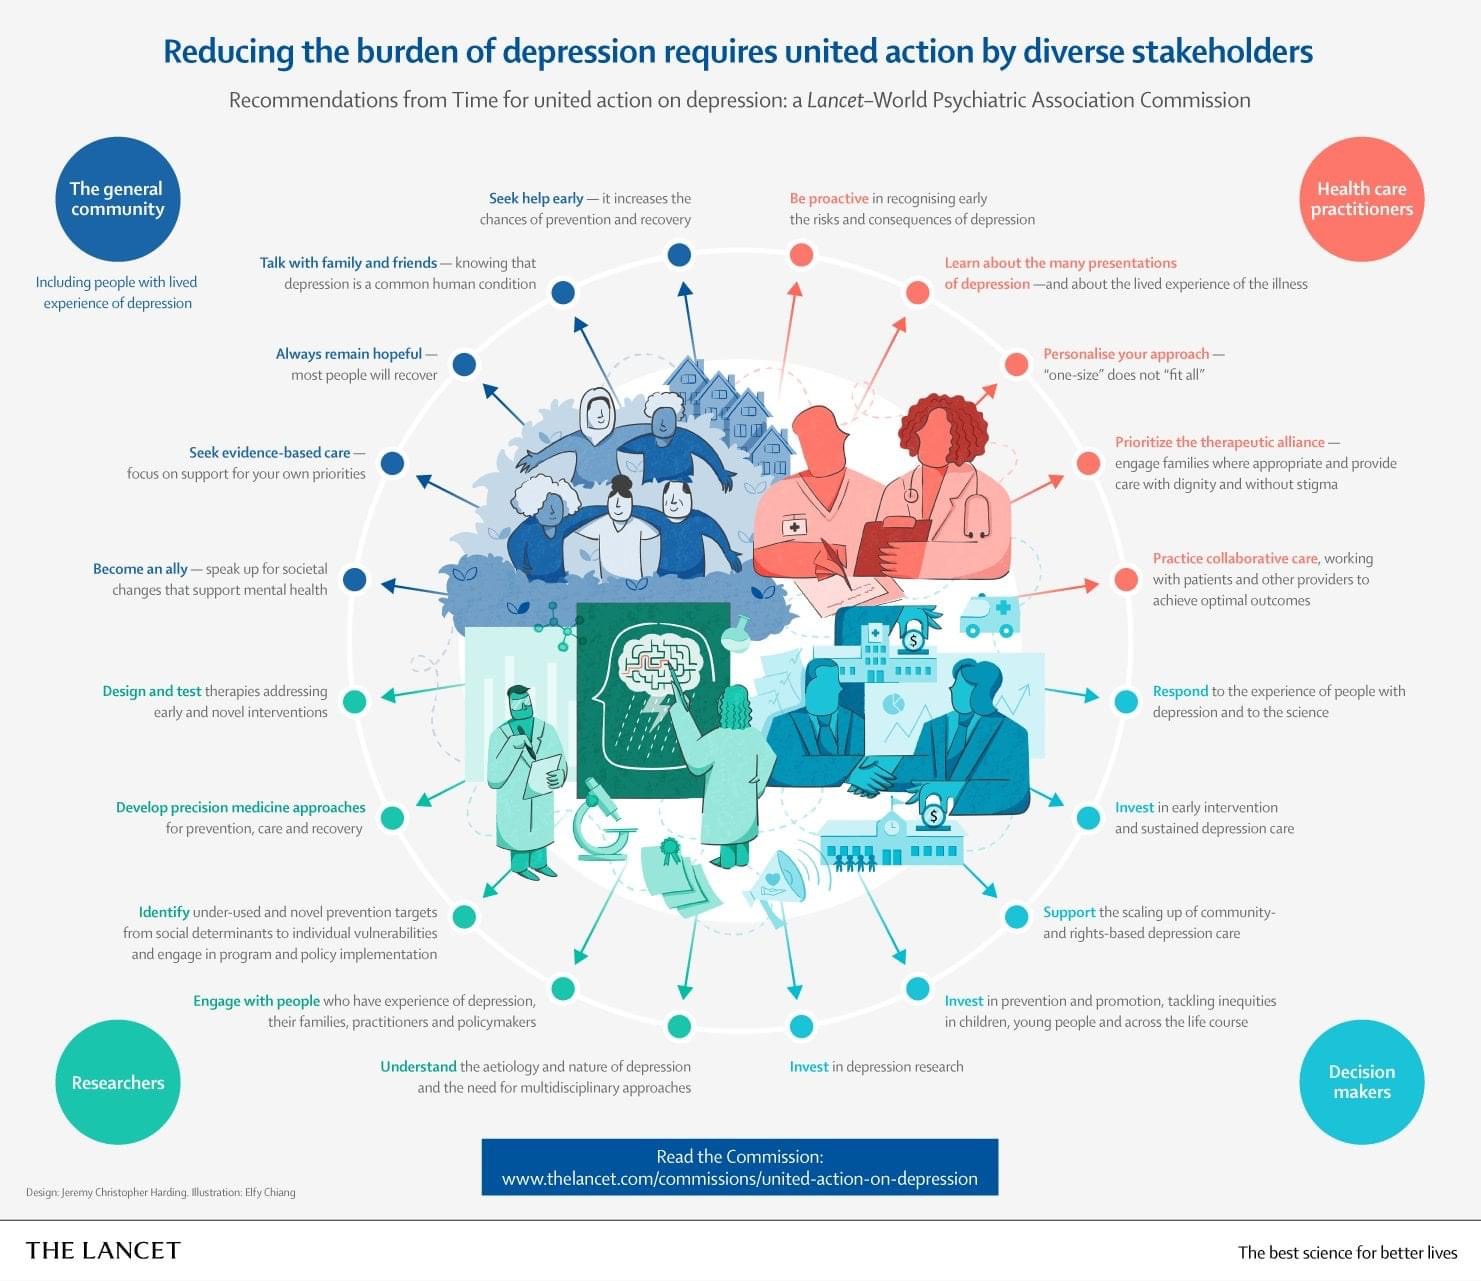
Paige Jarreau: I really love this infographic by Avesta. It has a lot of scientific information but also takeaways for people to protect themselves from COVID-19. It’s so much information in one place, but draws you in to learn more.
Q. How do you know when your infographic has too much or not enough information?
Nigel Hawtin: Show what you are working on to somebody who doesn’t know the subject and see if they ‘get it’. It’s also not about simplifying it… it’s more about editing the information so that it’s understandable and accessible but not necessarily simple.
Gaius Augustus: I think every infographic should have one key message. You need to know who your audience is, what background information they have. Ask yourself if each piece of text is directly relevant to your message! If not, take it out. If you’re struggling, that may mean:
(1) you need a different medium (comics, video).
(2) you may need a second opinion (mentor or friend).
This may mean that you need to take out details that are really interesting, or that you can’t get as deep into the topic as you’d like. That’s ok, because you can always make more infographics!
Olivia Preston: I guess it’s the same as building data dashboards, and being ruthless with yourself on what the audience needs to know (that can be a different answer from what you, knee-deep in the data, thinks they would like to know). Different way of saying “start with the end audience in mind”, especially their prior knowledge of the topic.
Matthew Griffiths: I’ve done quite a bit of animated infographic work which is great in that you don’t see all the information at once and have to tell a story with it. Also have been loving these artists who visualize in art but have science/data behind it: Instagram.com/fabianoefner.
Julia Krolik: Matthew I LOVE data art. Below are some examples.
https://pixelsandplans.com/live/flow/
Matthew Griffiths: I agree with Nigel – I call it the mum test. If mum can understand it then we’re good! I think we can also ask if every piece of information is necessary and backing up the main point. Always go for the simpler option. It’s easy to keep adding “more” but is usually a bad idea. Bare necessities – especially for the general public who may not understand complex research/concepts.
Shelley Hollingsworth: Some data can have annoying caveats which don’t fit neatly into an infographic, but to ignore their existence might mislead. Never sure what to do about that.
Olivia Preston: 100% agree with Shelley. Another useful thing is to use normalizing factors if you are including numbers. e.g. Company xxx water use per year is 11,000,000 cubic meters per year…… YAWN!. Normalize a number into something the reader can more easily understand – e.g. “We use 1,500 olympic swimming pools of water every year, or 10 per day“.
Q. What are any ‘gimmicks’ to avoid?
Nigel Hawtin: I always begin with sketching the graphic out in pencil/pen/sharpie… if you can make it work in black and white or using only one color, then that’s a good start to a graphic.
Gaius Augustus: This is another really great question! What comes to mind first is when the creator tries too hard to be trendy or funny. You can definitely use humor!!! But it should be natural. I get annoyed when an infographic seems like it’s trying too hard. That also can be said for when they feel like they’re patronizing or “dumbing down” the info.
Matthew Griffiths: Ooo good question. Gimmicks – I’d suggest not using a shape/style/etc. unless it’s relevant to the topic you’re covering. Sometimes we get excited by a visual but it doesn’t actually serve the data/message. I remember once I REALLY wanted to do isometrics – and I got into a whole world of pain because I spent AGES doing isometric animations because I wanted to, not because it enhanced the data. Then it was also super hard to let it go as I’d invested in isometrics. Lesson learned!
Marina Tomás Teixeira Carvalho: I try to be more conscious now of how the public will read an infographic. Sometimes you assume that a reading order is obvious but in fact this is just an assumption based on how you read that image. Now I try to reflect and not to assume that something is common understanding. I also try to test the image with some readers before release.
Q. How do you START with making an infographic? What is the first step?
Gaius Augustus: I start out making a plan. Sort of like a mood board, but with the necessary text and imagery. (I have a plan template here). The very first draft (and second, and third) are all done by hand for me.
A mood board is one place where I collect my thoughts about a project. Not a brainstorm, but a curated place. For example, I use it to collect the main message, the text for the infographic, the color palette, the size options I want, sketches for the design of the infographic, references to images that I’ll need to draw, etc.
Nigel Hawtin: I always start by drawing something by hand. Sketching is a simple way of getting ideas, hundreds of ideas, out so you can see and try them.
Shelley Hollingsworth: I think hand-drawn for the first couple of drafts is ideal. But first you need to know what message you want the audience to have, and what data will back up that message. The ideas for a design will flow from that.
Matthew Griffiths: I start by trying to understand the data/topic, what’s important about the data and what’s the key message. Then I maybe surf around for some inspirations, see what’s out there, what visualizations I could build into my design (part of the mood boarding). I still sketch by hand very roughly. When I start with the final product I also try to divide up the pieces of information into pieces that I can move around and try different flows etc. I often find once you get into it you may need to be flexible and let go of the original layout idea a bit and adapt.
Marina Tomás Teixeira Carvalho: I start by looking at the source material, dividing it into small pieces and then deciding if what’s written is enough or too much before doing any drawing and also I take some time to think about a general idea I have for the piece that can combine all that information (e.g. a map, a process). If I am working with a client I may need to do some chat with then until we reach a agreement. Only after I am satisfied with the general concept and the amount of information that will be used, do I start to do some sketches based on the pieces I decided on before. I may combine them and also change the text during the creation. Having a sense of how much information I must fit and how the information will flow helps my process a lot.
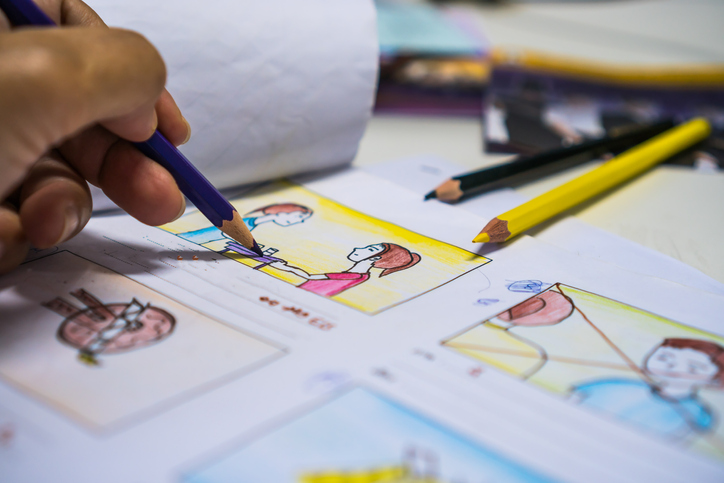
Pooja Gupta: I try to pick themes and subtopic where relevant from my source. Similar to Nigel, lay them out as a storyboard with text on one side and visuals on the other (I’m used to doing this for films, so apply it from there)… It also allows the scientist to see how I am thinking and fix errors along the way instead of when it’s too late. I first describe the visual using words and work on sketches as the next step.
Q. How do you decide what forms of data visualizations to use in an infographic?
Gaius Augustus: Unpopular opinion: I actually first ask myself if the data viz is necessary for the message. I often find that the imagery can get across trends without adding graphs, especially since many people don’t know how to read graphs. Just want to say first: any data viz that doesn’t also incorporate graphic design principles will not work.
I tend to ask myself what the message is that I want to get across. A trend over time? Comparing 2+ groups? Usually, if I ask myself what the message is, the type of graph/chart is more obvious.
If you’re a scientist used to looking at data, you should definitely find someone from your audience to look at the data first. What may seem straightforward may not be so clear to a non-expert.
Travis Barney: Sorta on this topic:

Marina Tomás Teixeira Carvalho: What Gaius said about asking if a graph is really necessary is so important. I am now working in a project focused on generating content for communities that the science communicators are not reaching in Brazil. One thing we are avoiding is the use of graphs about flatting the COVID-19 curve here, because it requires people to understand some abstractions that are not exactly simple for all publics. We found that the graph wouldn’t work on our public, instead we are trying to find creative ways to communicate that same information.
Olivia Preston: Decide first what you want to show – obvious but sometimes forgotten. e.g. distribution = histogram or scatter plot. Composition = columns or pie / donut charts. Comparison = treemap or line chart if over time.
Julia Krolik: We have a TON of resources at the Data Visualization Society on chart best practices.
Avesta: Ferdio created the Data Viz Project that nicely summarizes different graph types and what kind of data you should use for them, I found it really helpful.
Q. How do you choose a color palette for your infographics?
Julia Krolik: Usually I have to follow branding guidelines. But also my recent fireside chat with Alan and Theresa on colour theory touches on best use of colour.
Gaius Augustus: I just keep a pinterest board of color palettes and choose the one that speaks to me.
Olivia Preston: Simplicity is best. Also be aware of accessibility & colour blindness, e.g. I avoid Red- Green on a colour scale (even though it naturally displays good / bad).
Julia Krolik: Use this tool to see how folks with colour deficiencies will see your work:
https://www.color-blindness.com/coblis-color-blindness-simulator/
Also use this tool for contrast checks:
https://webaim.org/resources/contrastchecker/
Matthew Griffiths: It’s always straightforward when the topic (or client) has a palette. But like you I usually have a color palette I’ve been waiting to use, but like Olivia says it’s important not to get carried away. Coolors is fun for ideas.
Nigel Hawtin: Tends to be client based colours but otherwise the subject matter can also determine the colour scheme… dark for space, blue for sea, etc. as a base colour.
Pooja Gupta: I often try to think of using colours that depict the content as well. Also, content often describes a certain mood as well and I use this to adjust the brightness / tone of my visuals. We don’t usually want bright, happy colours while speaking of deaths during a pandemic for instance, to keep it obvious.
AEDraws: While there’s a lot of different considerations to make when choosing a color palette (eg. client requests, cultural symbology, etc) I think one of the most important things for beginners to focus on is making sure the colors read clearly as values. It doesn’t matter what colors you use, if their values are too close together then your infographic will be hard to read (low contrast) and difficult to follow. Below is an example of two animation professionals redrawing a student’s submitted design, showcasing how important it is to make sure distinct values are chosen for the information to be clearly understood.
If you’re unfamiliar with color / value, this might be a helpful video:
Q. Do you need formal training?
Gaius Augustus: Unpopular opinion: Practice can only do so much without knowing why you’re practicing. Having a mentor or coach can make practice more meaningful. I don’t think it’s necessary to get formal training. But definitely learning can go faster with formal training or mentoring. I went to an art school for middle/high school and then to an arts university after. But that was before YouTube!! I learn tons from my friends on social media, too!
Don’t be afraid to tear apart (aka critique) infographics that you see and love online! What makes them successful? What could they have improved?
Matthew Griffiths: Part of that experience/practice also needs to be trying new things. New shapes, styles, etc and playing so you can add them to the repertoire. And there’s loads available to learn on youtube for free.
I didn’t get any formal training… I’ve picked it up through doing and finding what I like as Gaius said. If you’re learning it can be good to find what you like and imitate it as practice.
Nigel Hawtin: Taking existing graphics and redesigning them is a great way to see what can, if anything, be improved.
Julia Krolik: 100% to learning fundamentals of graphic design theory!!!! PLEASE! Even the first two free Coursera courses from the Graphic Design Specialization will do to get you started. Pencils, PowerPoint, Adobe, Canva, etc they are just tools. If you have even a hint of design theory … it will take you a LONG way. <3
Also this book is a great resource:
Q. Do you have a preferred illustration style for infographics?
Marina Tomás Teixeira Carvalho: I usually use simpler illustrations but I have seen some works with very detailed illustrations and with more complex painting styles and I always wonder if there is a style that is easier to turn into a infographic or to understand or if it depends on the idea of each work.
Shelley Hollingsworth: I think each work needs to be considered individually.
Gaius Augustus: I agree with Shelley. For me, the style is dictated by the feeling I get for the topic or the client. It’s weird because in art, there was always such pressure to have me “develop my style” and to only work with clients who wanted “my style”. But I’ve found that having a more flexible and fluid style really gives me freedom and makes me happier, too!
Nigel Hawtin: Each graphic, subject matter and client may be different.
Matthew Griffiths: I think picking a single style for an infographic is important. But that can change from one infographic to another based on topic. Usually I prefer simpler/clearer styles like vector animation (this also makes things easy to move around and try different flows) so I would definitely recommend that for infographics work.
Q. Which software do you recommend to create infographics?
Gaius Augustus: This is a great and common question! There are tons of software options for you, but first I want to remind you that it isn’t always about the tools. It’s about the skills, and you can definitely learn those. I also have a blog post that might help, but don’t underestimate the power of pen and paper or tools you may already have access to (Powerpoint, Google Slides, Canva).
Travis Barney: I don’t mean to taut up AffinityDesigner on MacOS so much, but it’s a relatively inexpensive option ($50 one time payment) that provides a blend of Photoshop and Illustrator (pixel + vector) tools. Here’s another free web-based tool called Excalidraw. Useful for quickly sketching out ideas and even collaboratively editing with your friends in real-time.
Matthew Griffiths: Adobe suite only makes sense if you do media and content for a living. They’re not cheap. And there’s plenty of free options available. When it comes down to it you can make a great infographic with pen and paper, or some of those free software options.
Paige Jarreau: I’ve used Canva to create infographics – but I think it’s important to realize that you don’t always need a tool – you can even draw an infographic by hand!
About the Lifeology SciComm Challenge
Each month, Lifeology is hosting SciComm challenges help you learn more about the science and practice of communicating science for broad audiences. These challenges give you the opportunity to practice communicating science more engagingly in a range of formats. Learn more about Lifeology.io.
In the spirit of this month’s challenge, we’ve created the following infographic to present the Lifeology Infographic Challenge!

Submit your Lifeology SciComm Challenge Infographic to Lifeology@lifeomic.com by the last day of the month!
Your infographic will be featured on the Lifeology blog and our favorite entry each month wins a prize – including a knitted science hat generously being made by Chanelle Zap! And definitely a feature on our blog!