Elfy Chiang is a freelance illustrator from Taiwan with a background in biological sciences. From illustrating Lifeology courses in LifeOmic’s personal wellness program (LIFE Ascent), to helping us meet other clients’ Lifeology course needs, to working on in-house courses, Elfy is no stranger to us at Lifeology. We love working with Elfy, and we love to see her succeeding with other visual projects. We have interviewed Elfy about her Lifeology-related work, but let’s check in with SciArt illustrator Elfy’s non-Lifeology-related artwork, including recent infographics and data visualization projects!
Q: Outside of Lifeology, tell us a little bit about the projects that you have been involved in, especially lately?
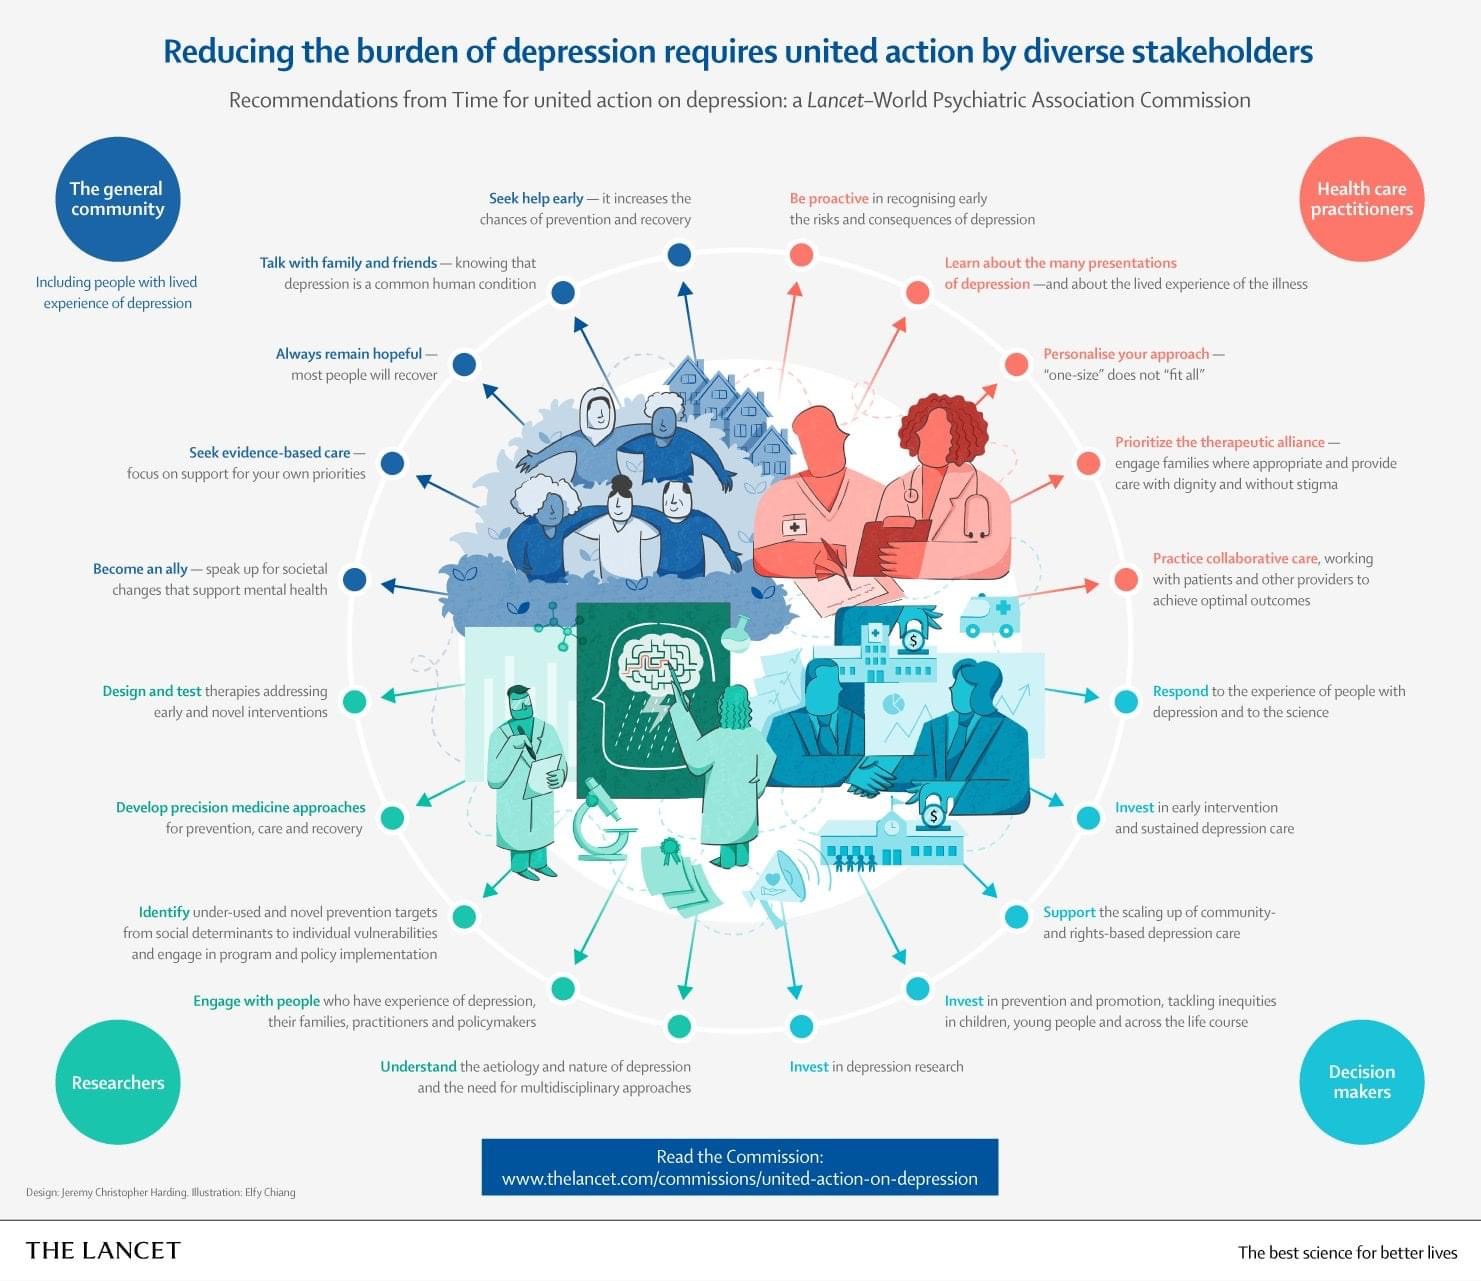
A: Apart from Lifeology projects, I also work with academics on graphics for their publication. Recently, I started to work with The Lancet on their infographic projects. So far, I have made illustrations for one of their commissions on depression, and two other infographics on rubella and cancer in sub-Saharan Africa.
Q: I see you have worked with some academics to create visuals for journal papers. Can you tell us a bit about how those projects came to be?
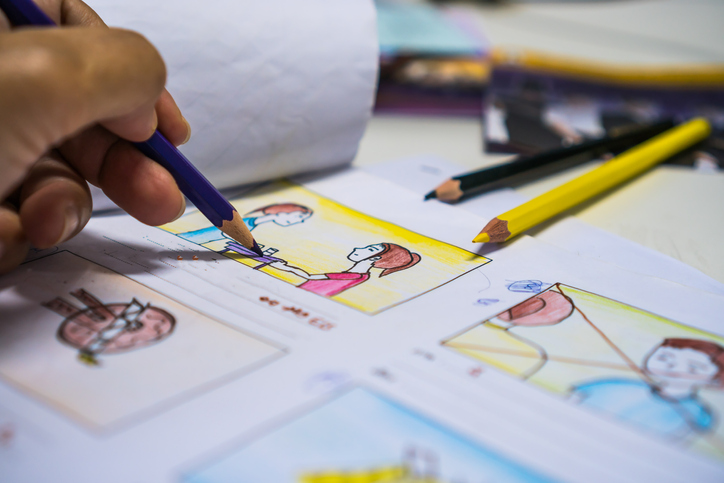
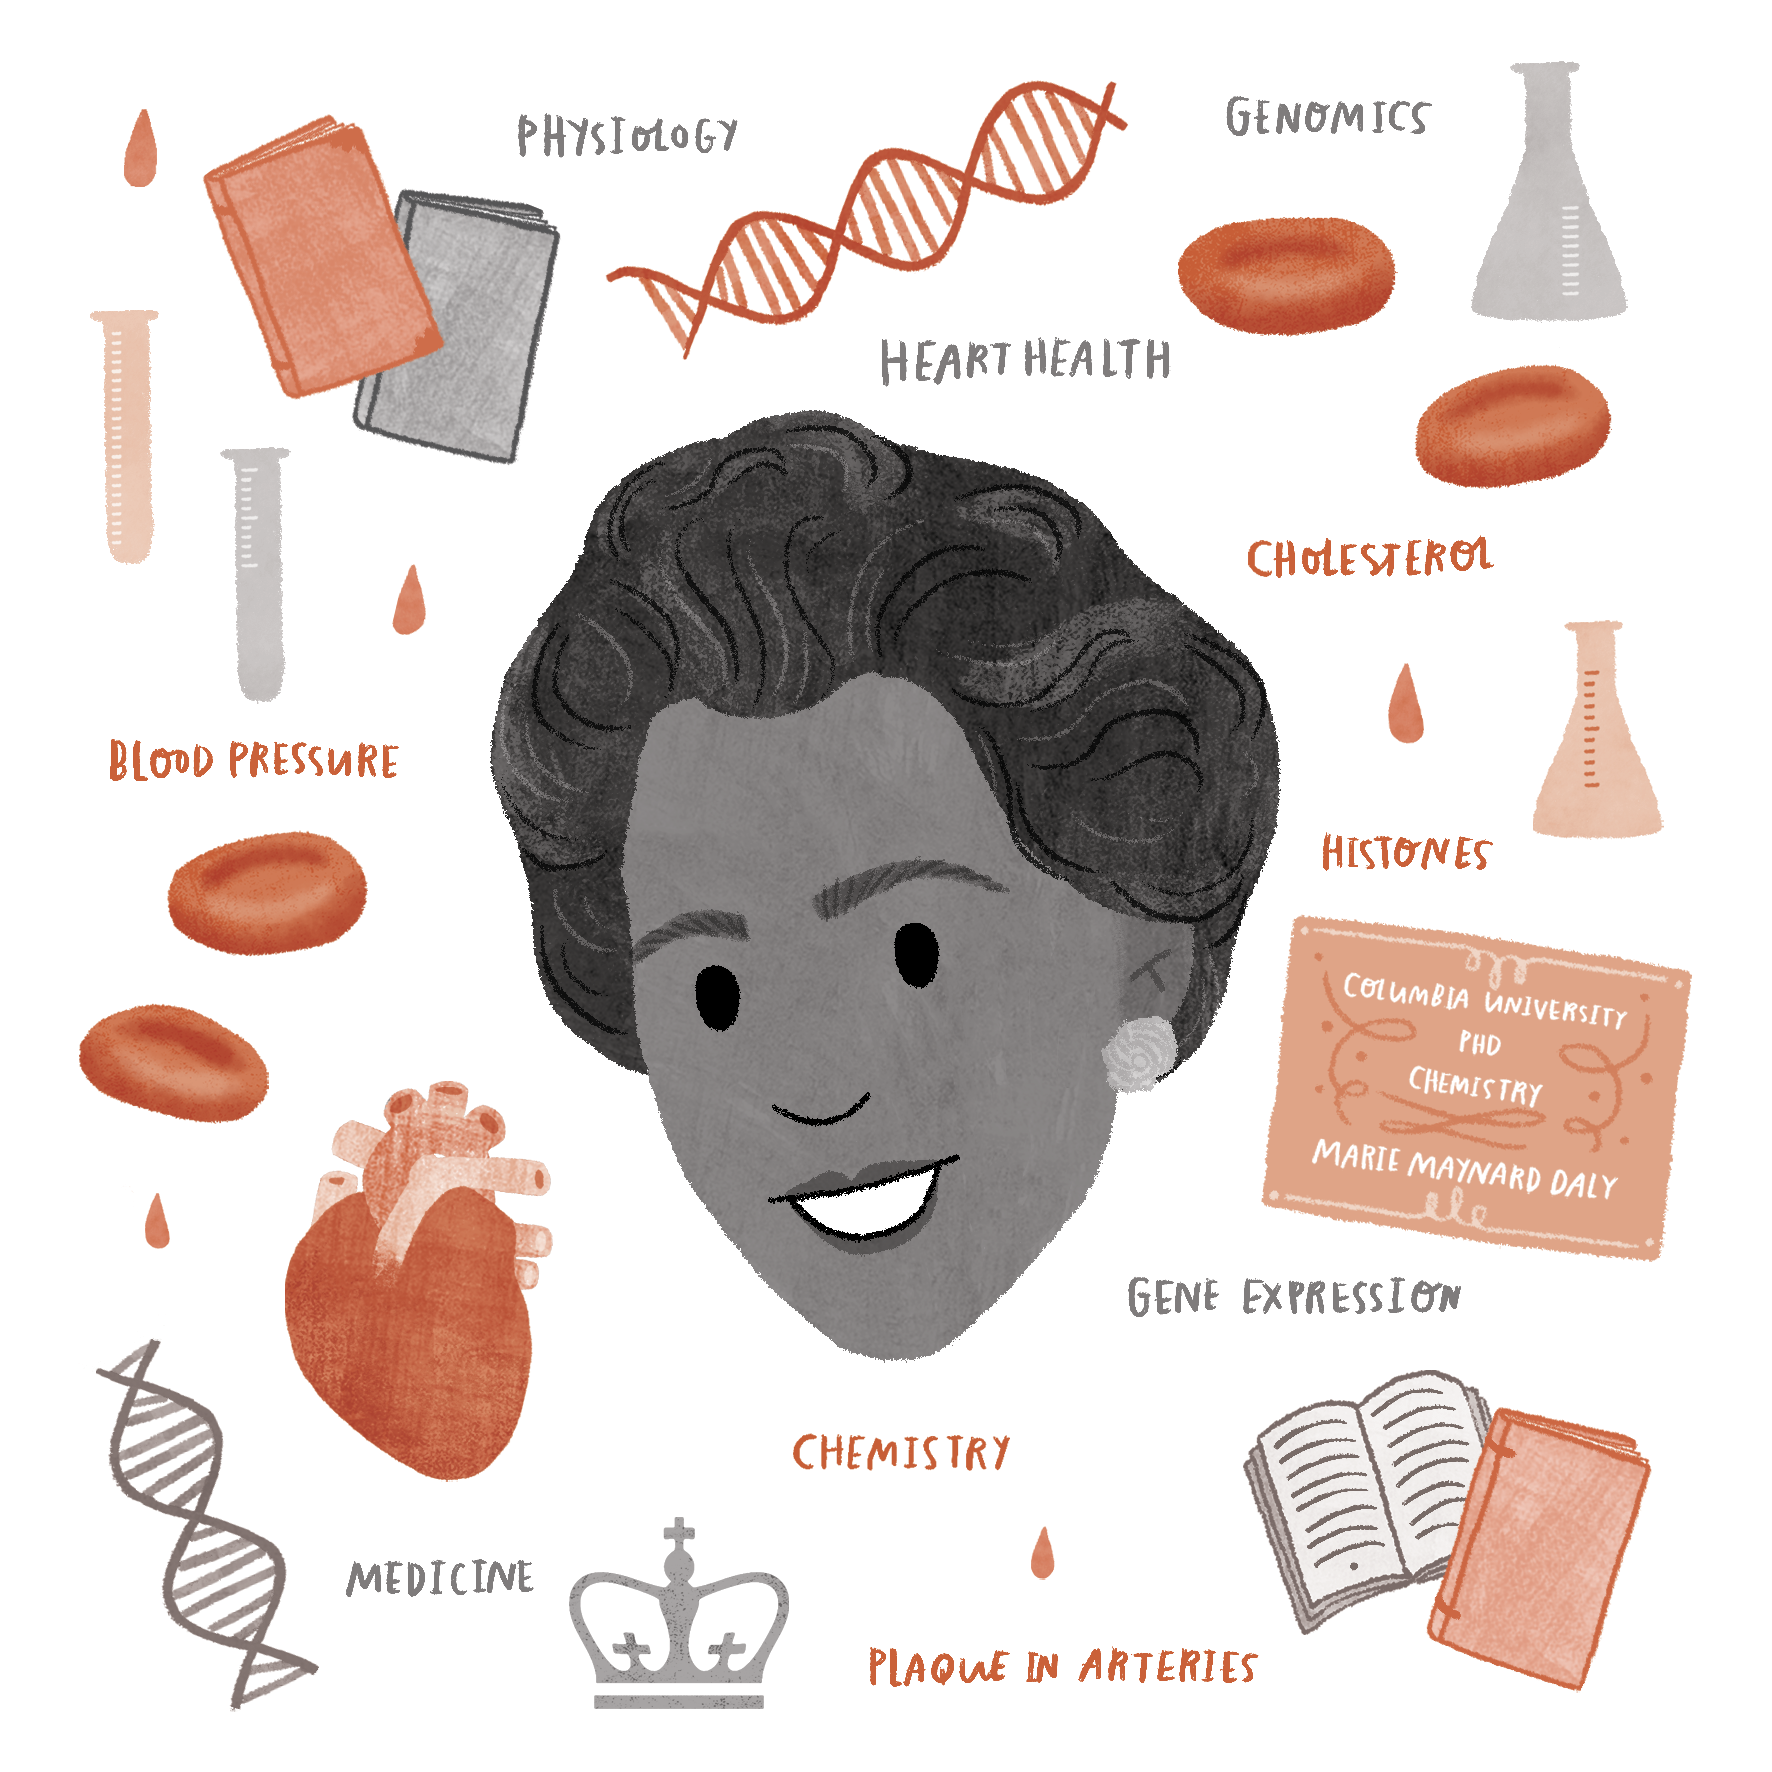
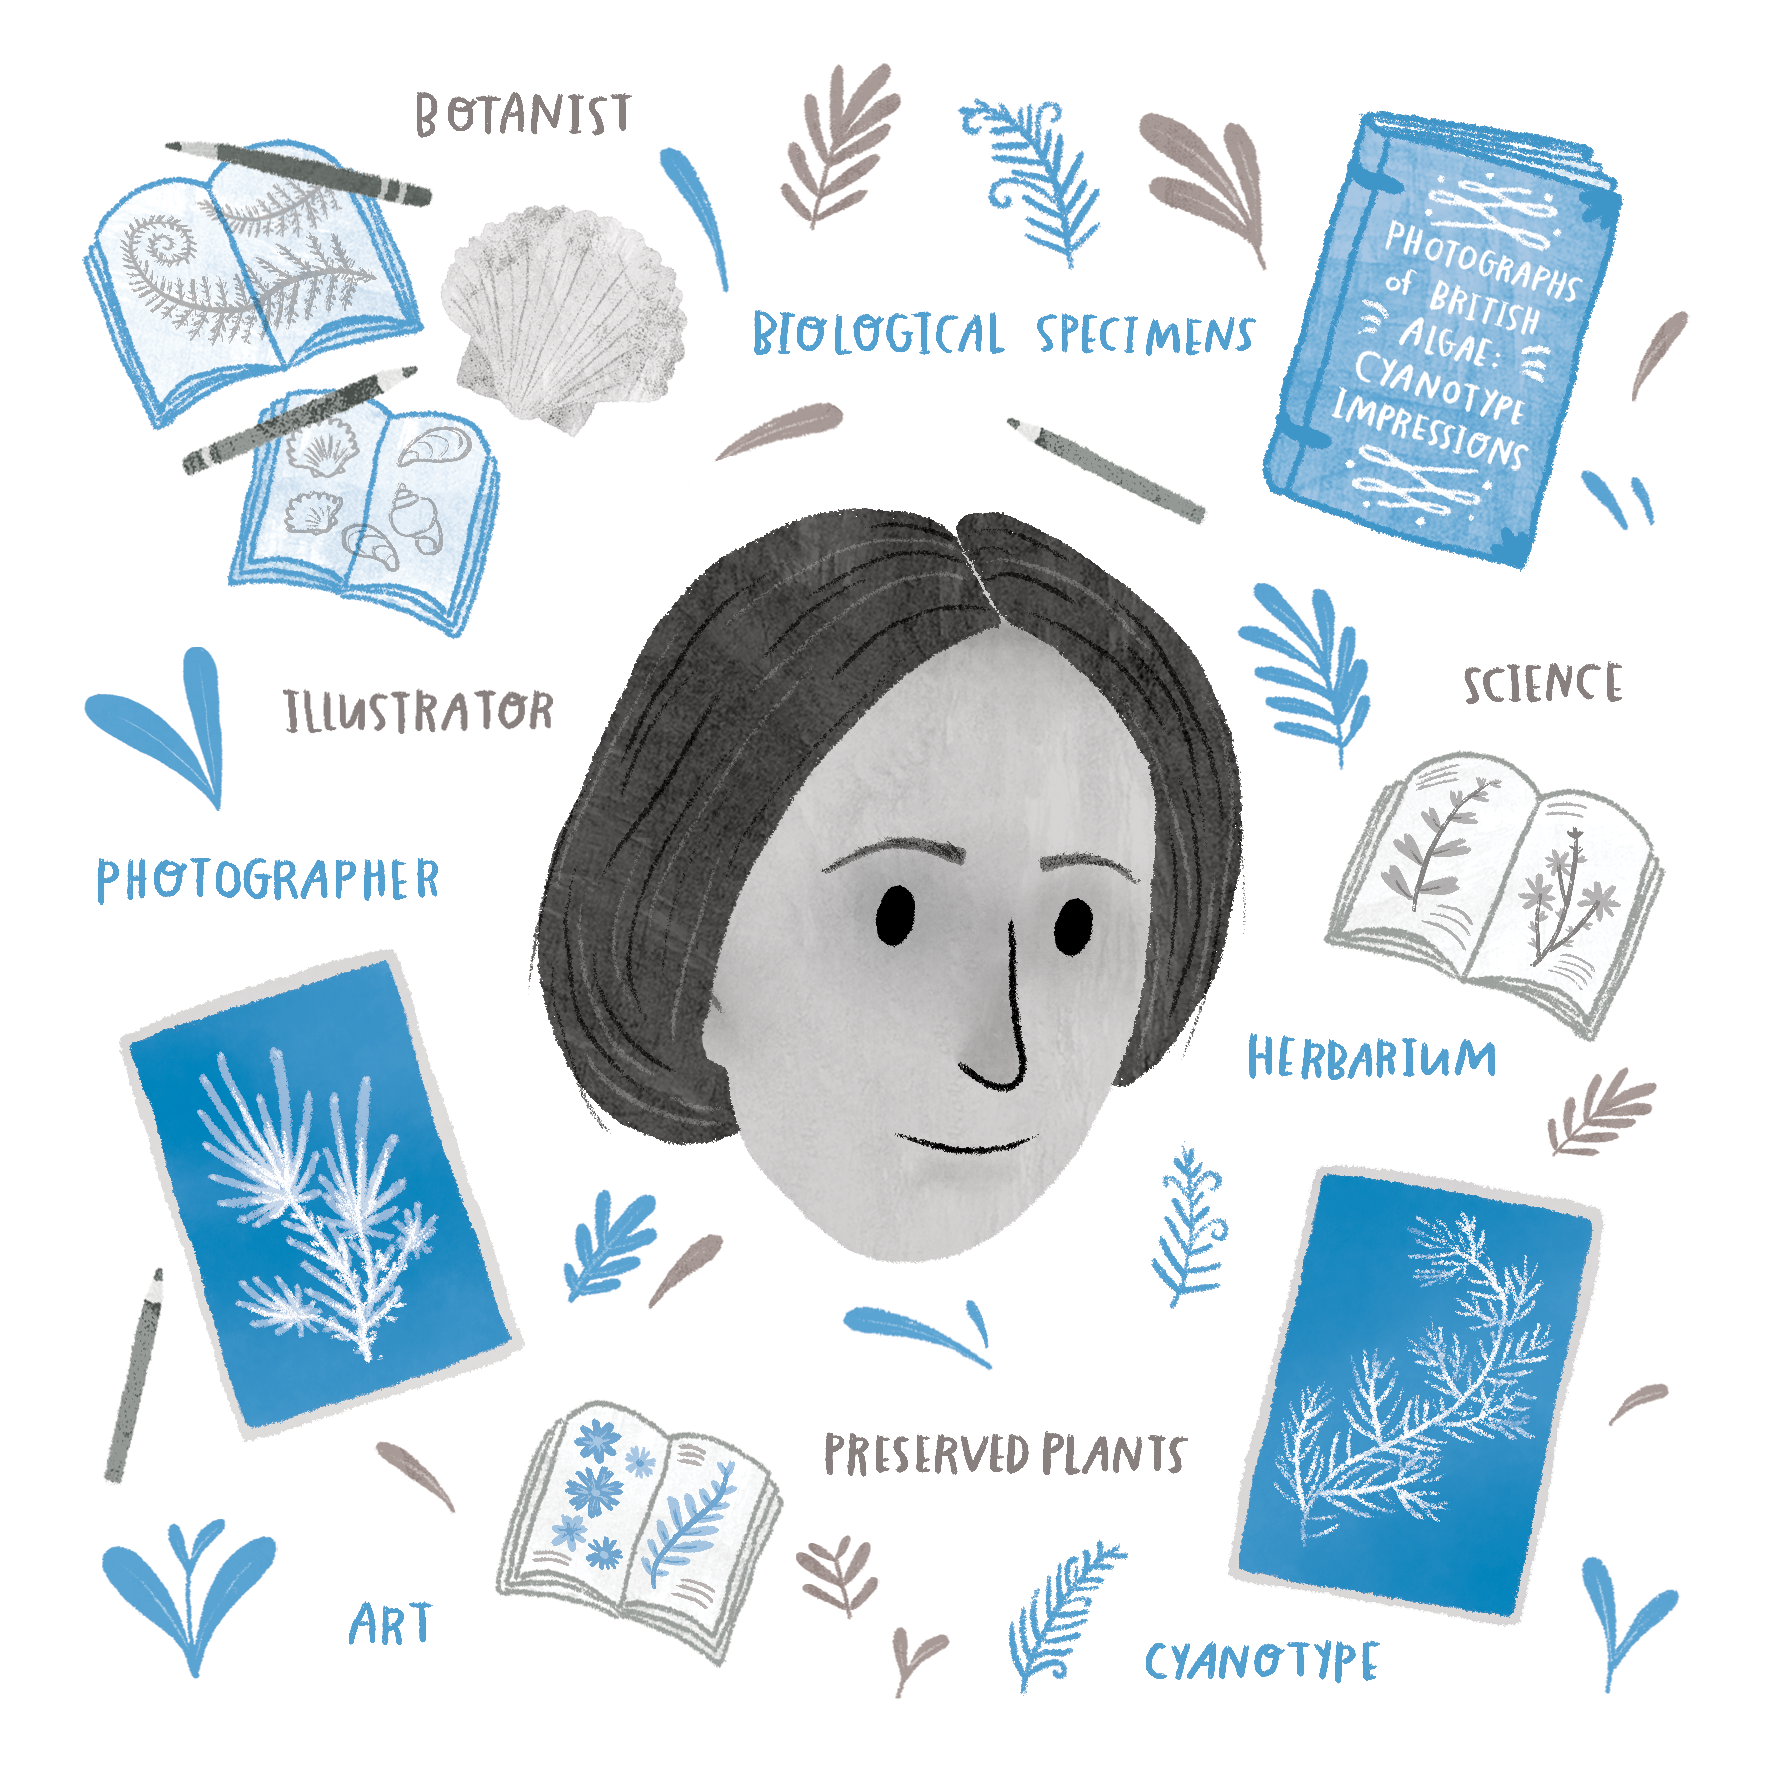
I regularly work with academics on graphics like graphical abstracts or pathological charts for their publication and most of my clients come from word of mouth, others found my work online.
The process is usually pretty straightforward. My clients would get in touch with a brief description of what they need and tell me a bit about their research. They would provide me materials like the abstract of their article or figure legends, along with example images or a simple image draft they made in PowerPoint while some also send me their rough drawings. I would get back to them with a few suggestions on the design with a quote and timeline. And if my clients agree, I would start by creating a quick draft where we’d continue to work on the details down the line until the final image takes shape. You can go to this blog post for a more detailed process with project examples.
Most scientists I worked with have never partnered with an artist before. They often come out enjoying the process and the results. Many have told me they would be happy to work with an artist again or recommend other scientists to do so.
Q: Can you tell us more about your project with the Lancet? How do you like the process of making infographics? Is there any advice for artists who are considering making infographics for clients?
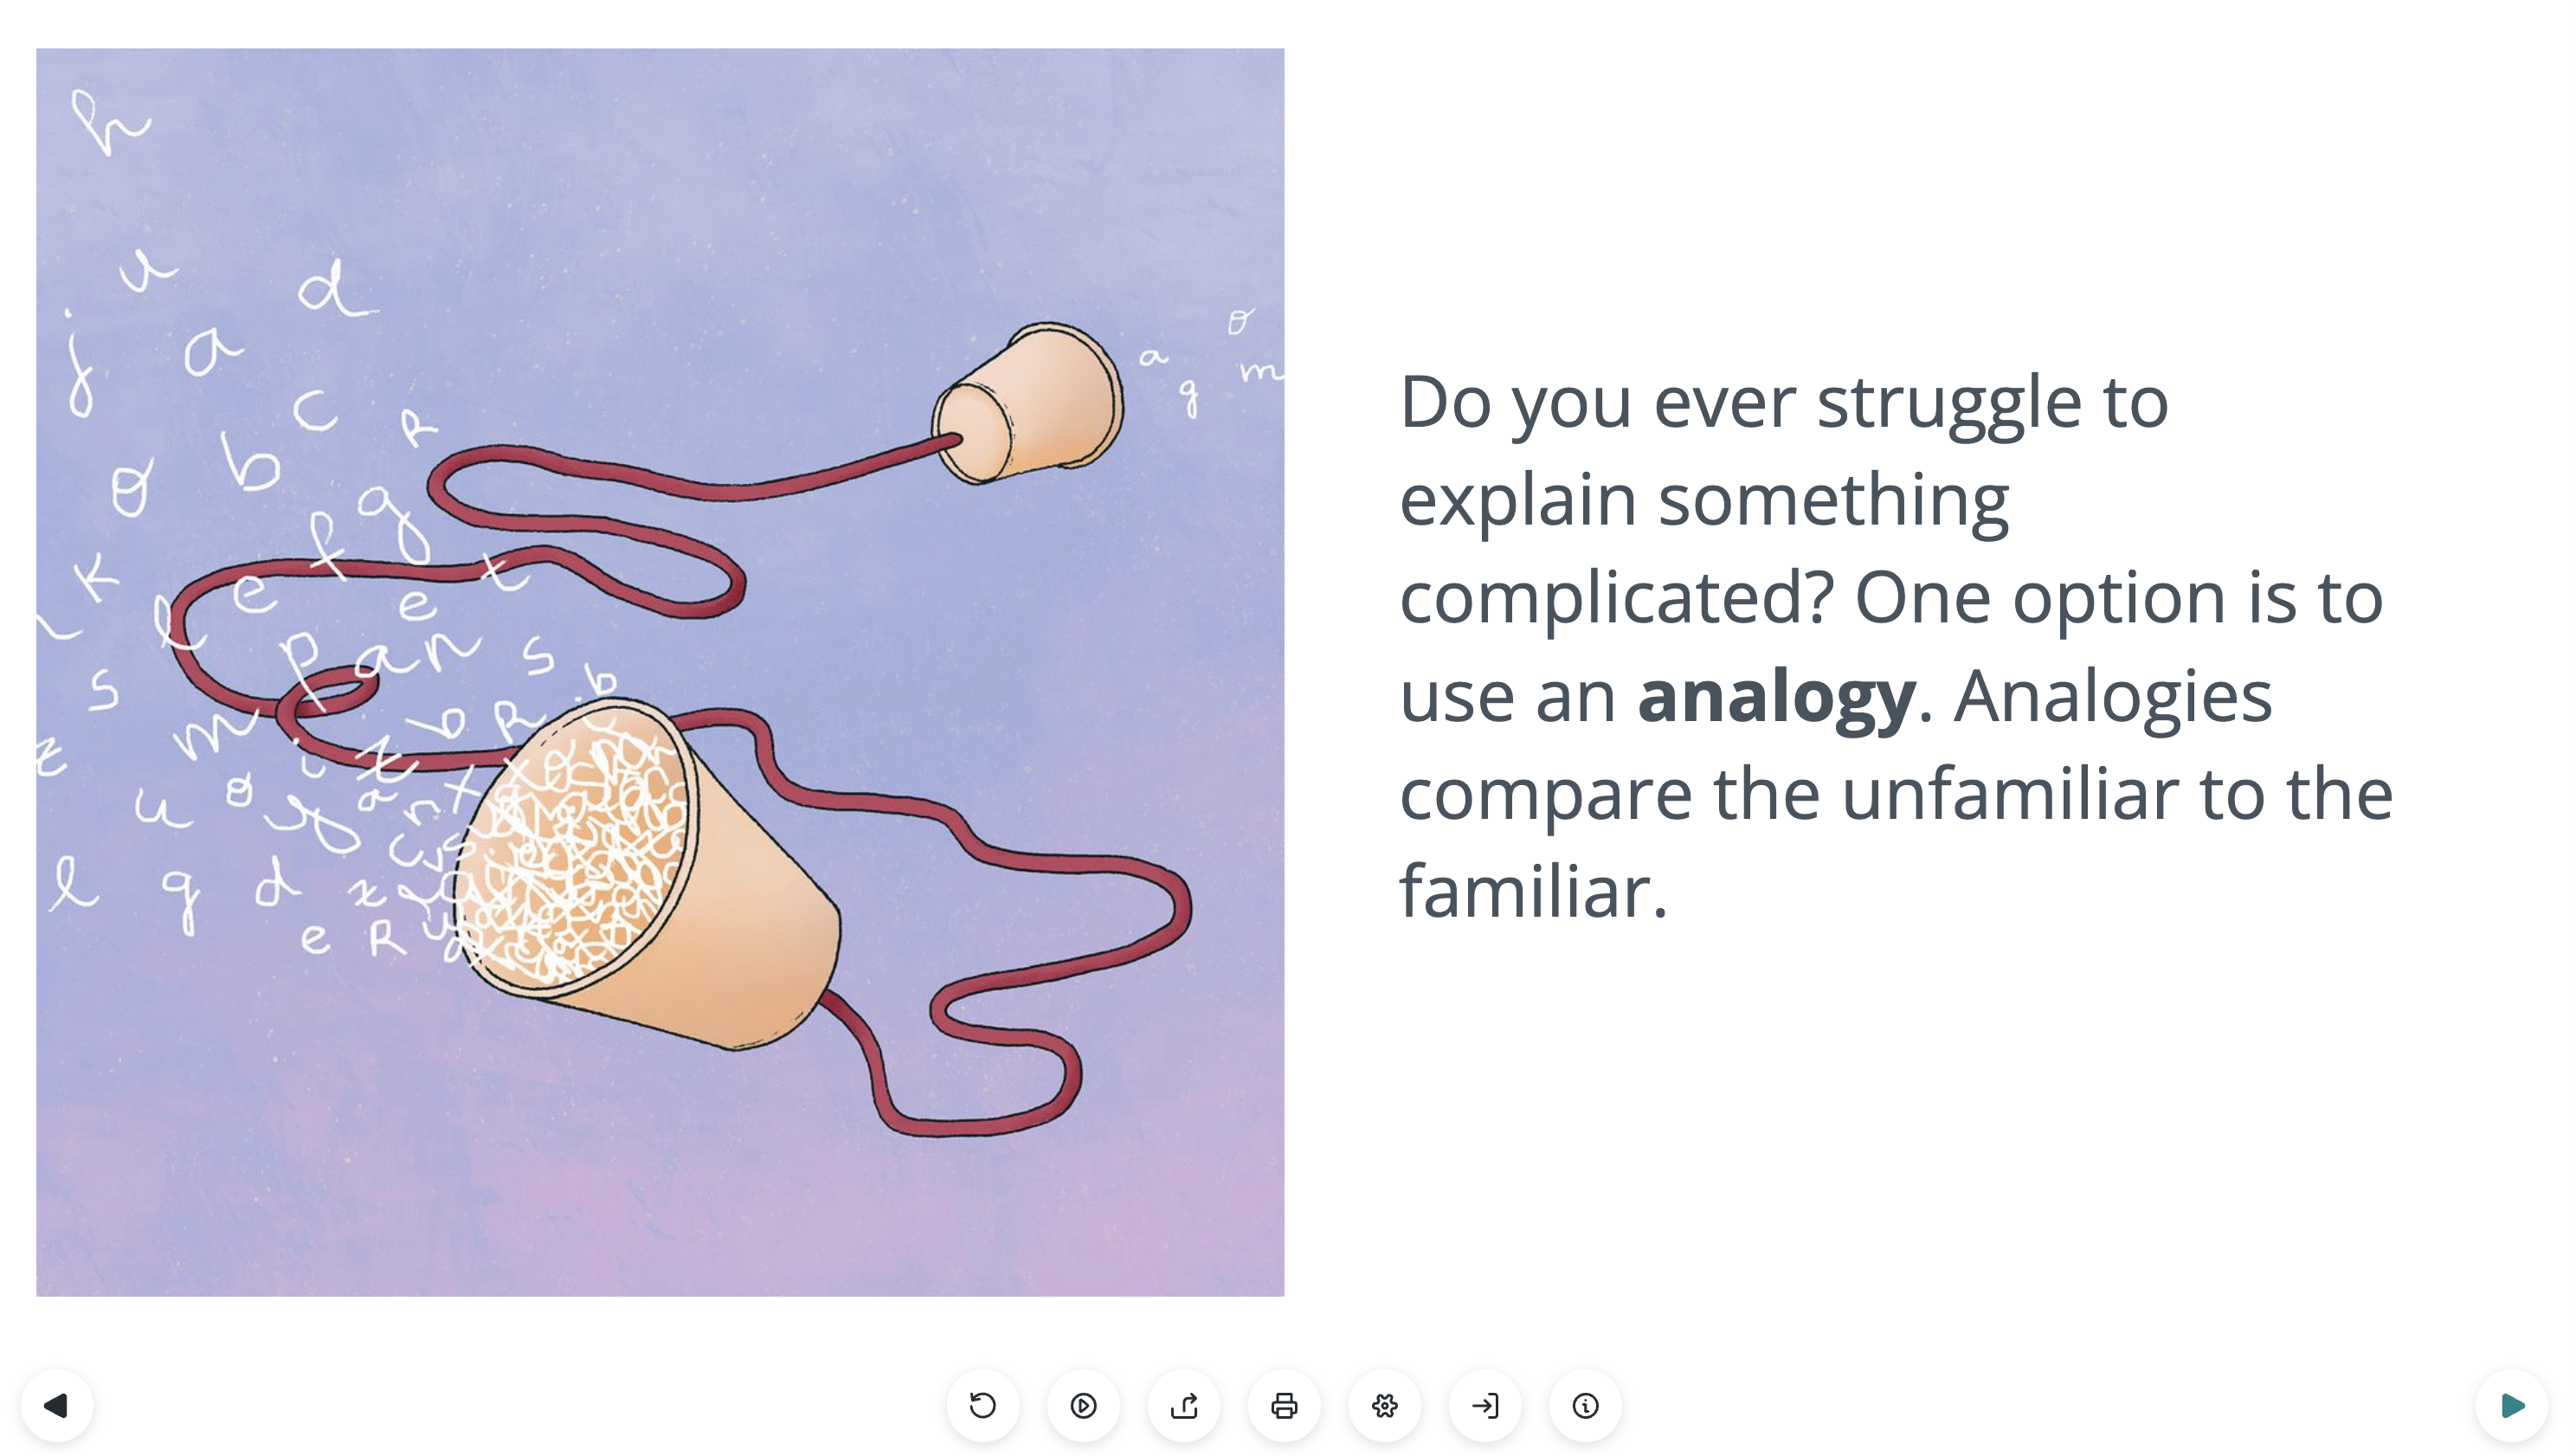
Infographics are one of the multimedia contents The Lancet regularly produces to summarize selected articles published across their platforms or journals. I enjoy it as I get to tap into the latest discoveries from a wide range of topics in medical research and transform the key information into informative visual graphics.
I also enjoy creating under the simple and clear visual style they have established for their brand which I think is important to designing informative and easy-to-read infographics. Sometimes the information can be complex and I think good infographics should be able to help or guide readers to absorb key information in a short time.
For artists looking into creating infographics, I think it’s important to work on topics that you like, so that you can in turn create something interesting to the readers. Take notice of your clients’ brand style and what they expect as well as what design elements would appeal to their target audience. Use universal icons or symbols and keep the charts simple but interesting.
Q: What advice do you have for artists that are trying to expand the type of projects that they work on?
It’s always a good idea to try new things. Create personal projects on the type of work you want to get commissions for and build a portfolio of it. For example, if you want to start getting work in cover art, create some covers! Look for journals you like and create a cover for it based on the articles published in that journal. Same with infographics, find a published article you find interesting and create a summary graphic out of it. Keep practicing and share your work online.