Bonnie Peterson uses embroidery to investigate cultural and environmental issues. She stitches words and numerical graphs on silk and velvet fabrics to make large narrative wall hangings as well as a series of annotated topographic maps.
One of her most formative experiences was spending her junior year of high school in Africa where her father was working. It involved a grueling separation from her teenage friends. Peterson studied psych-soc and statistics at the University of IL – Urbana and worked in marketing research while studying for an MBA at night. She has been a tax preparer and a ski bum!
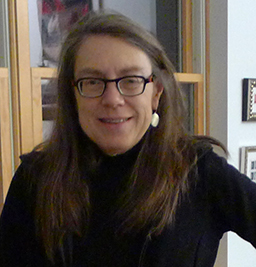
Bonnie Peterson – Visual Artist
The topics of her artwork follow the trajectory of her life experiences from the earliest family and human rights issues to outdoor adventures and environmental science.
“When I was in my thirties and home with young children, I lost a close friend to breast cancer. I stitched bras, her poetry, and related news items into a wall hanging. Breast cancer was a taboo conversation topic in the early 1990s, and at an exhibition I observed people laughing at the bras. As they approached closer, they started to share their own experiences and it was a source of satisfaction for me to encourage this discussion.”
When Peterson’s ‘bra quilt’ was rejected by quilt shows, she entered it into art exhibitions where it was accepted as sculpture or mixed media. This was the beginning of making art and several grants from the Illinois Arts Council based on her personal, social and political-themed work encouraged her to continue.
How did you get into embroidery?
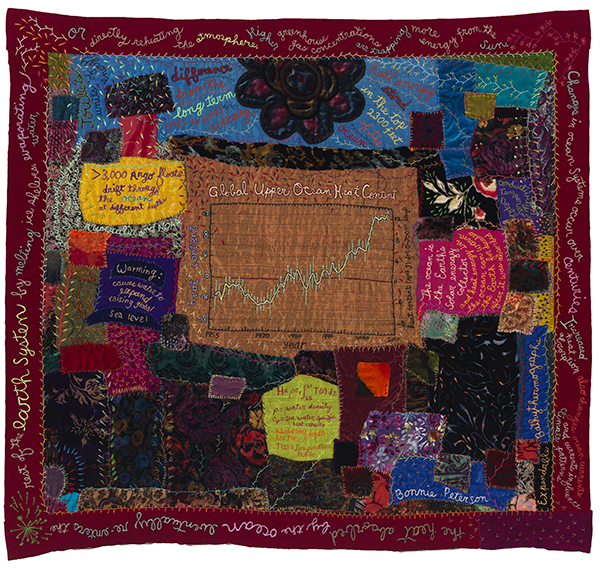
Text is the most important element in my work. In early work, I added text through dye transfer or heat transfer methods. Now I primarily use free-motion embroidery or hand embroidery to make words and graphs. My hand guides the fabric under the machine’s needle. The little grippers (feed dogs) that are normally under the fabric and move the fabric forward under the needle are inactive. This way the fabric can be moved anywhere and I can write cursive text or printed letters that are in my own handwriting. I add crazy-quilt stitches and other distinctive marks by hand. Ocean Heat (38’ H x 41” W) is a good example of this.
Ocean Heat, embroidery on silk, 38″H x 41″ W – Heat content in the top 700 meters of the ocean, data collection tools, and the relevance of heat content to climate science. Image courtesy of Bonnie Peterson.
Do you use any other mediums?
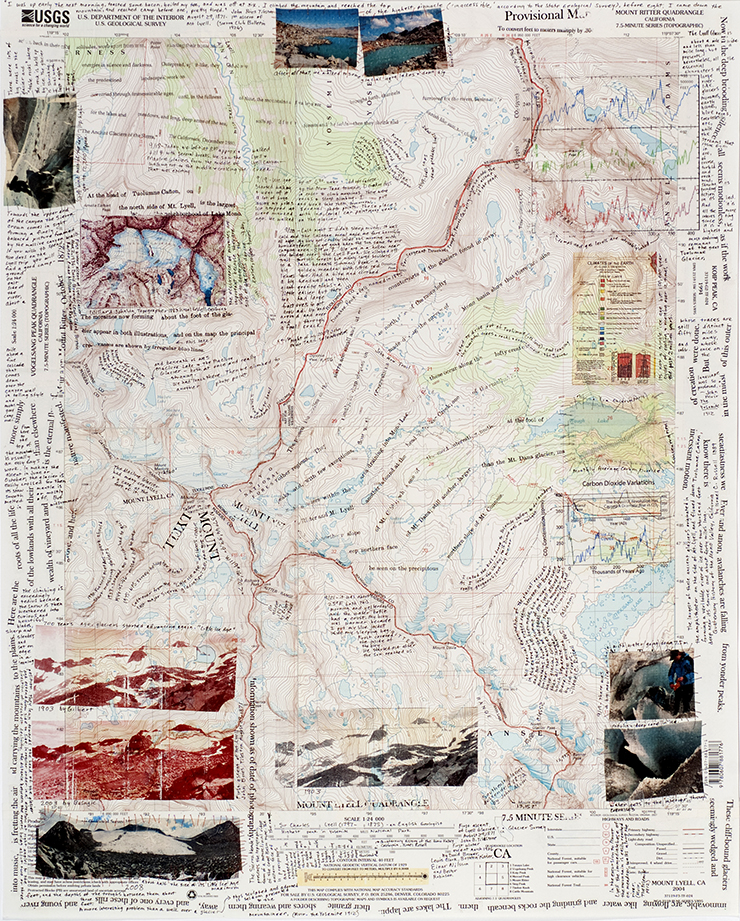
I also make annotated topographic maps. I became acquainted with the standard USGS 7.5-minute (1:24,000 scale) topographic maps while backpacking in the Sierras. They are the foundation for text and images stitched or transferred and pen. The text provides historical context, scientific terminology, and dictionary definitions. An example is Glacier Survey Map. Four, 7.5 minute quadrangle topographic maps were cut up and reassembled into one standard 7.5 minute map. The Lyell Glacier, the largest glacier in Yosemite National Park, is in the center. In September 2008, I backpacked with the annual Lyell Glacier Survey to measure the Lyell Glacier.
Glacier Survey Map, 27″ H x 22″ W, Heat transfers, silk transfers, pen and stitching.
Four, 7.5 minute quadrangle topographic maps (Mt Lyell, Koip Peak, Mt Ritter, and Vogelsang Peak, CA) were cut up and reassembled to appear as if they are one standard 7.5 minute map. The 4 maps surround the Lyell Glacier, the largest glacier in Yosemite National Park. In September 2008, I backpacked with the annual Lyell Glacier Survey. Image courtesy of Bonnie Peterson
Your art uses both science and art. Does one take precedence?
I am an artist. I was introduced to climate data during two artist-scientist projects sponsored by University of Wisconsin. One scientist had contributed to a recent IPCC report and I became acquainted with CO2 measurements.
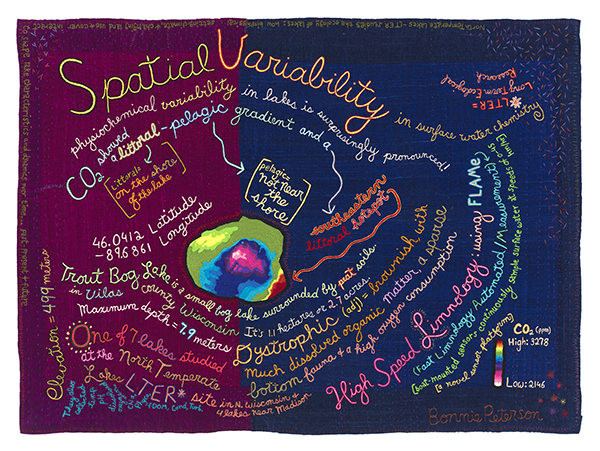
A recent work using data from an NSF-Long Term Ecological Research site in Northern Wisconsin is this project:
Fast Limnology, 31″ H x 42″ W, embroidery on silk.
Chemistry data for Trout Bog was collected by pumping water to automated sensors installed on a boat going back and forth across the lake’s surface. There is considerable variability in CO2 across the lake’s surface. Other physiochemical properties were collected at the same time (temperature, dissolved oxygen, pH, conductivity, chlorophyll, phycocyanin, turbidity, & dissolved organic matter). (FLAMe = Fast Limnology Automated Measurement).
The research was accomplished at the Northern Temperate Lakes LTER, a project of the National Science Foundation and administered by the Center for Limnology at the University of Wisconsin-Madison.
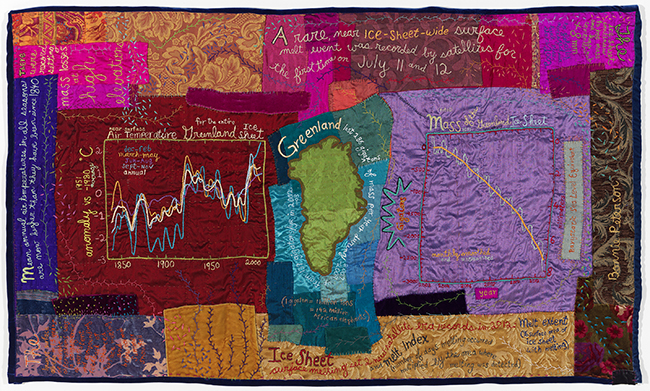
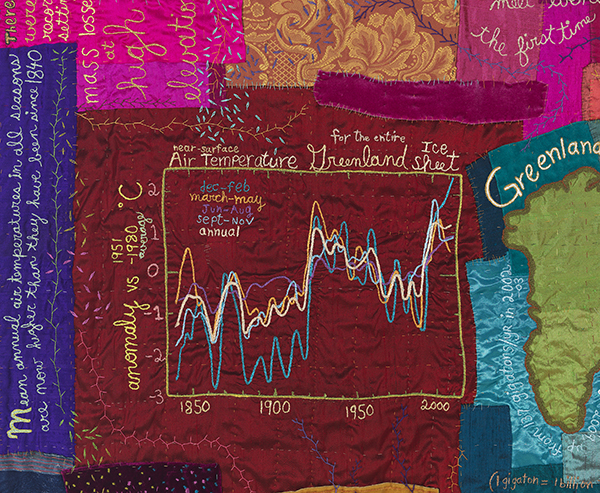
I seek simple explanations for the important principles in environmental science and attempt to convey simple and complex layers of meaning. The foundation for each project begins with developing an understanding of published research and climate data generated by satellite instruments and other exploratory data collection tools. Turning Green uses glacial mass data for Greenland which was collected by the Grace satellites.
Turning Green, 32″ H x 52″ W
Embroidery on silk, velvet and brocade illuminate data about the melting of Greenland’s glaciers.
Mass data is from the GRACE satellites profiled in the New York Times Magazine, Sept 12, 2017
Private Collection
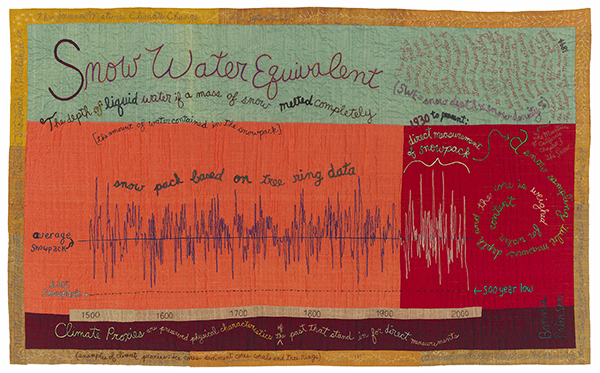
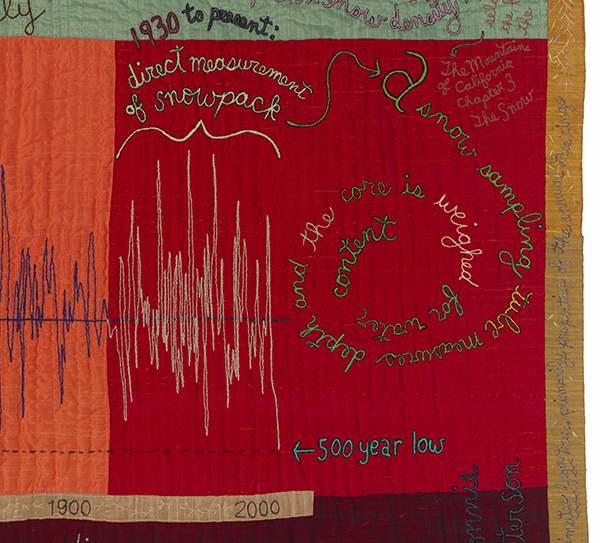
Conversations with scientists help me interpret key concepts and clarify their context and relevance. Sometimes math and science are intertwined as in Drought, an embroidery addressing the calculations associated with California’s “500-year drought.”
Drought, 38″ H x 55″ W
Embroidery on silk of data explaining snow water equivalent data and tree ring science for California’s “500 year drought”.
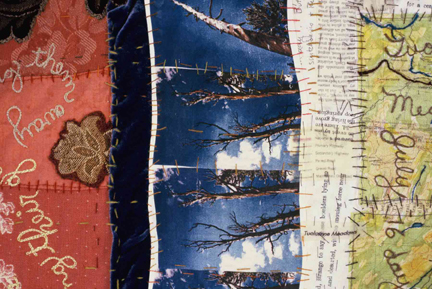
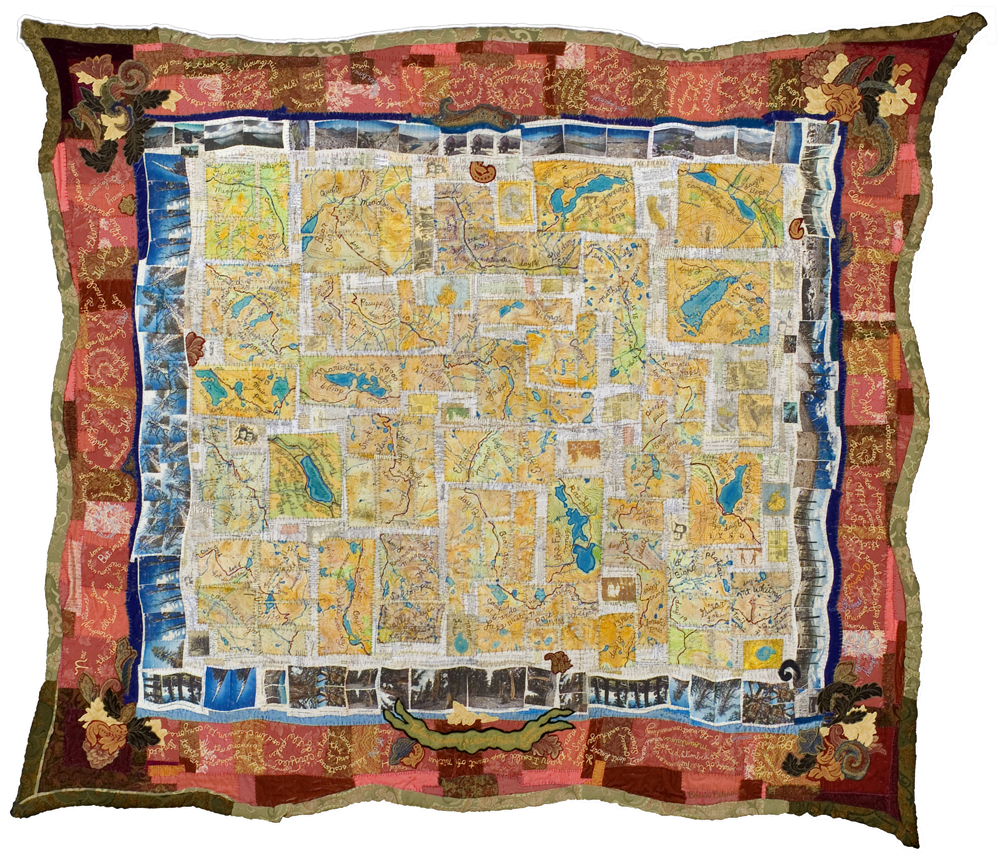
My interest in climate science is motivated by backpacking trips in California’s Sierra mountain range. Lengthy walks and primitive exploration integrate the impacts of contemporary society and historical context and provide a novel opportunity for the consideration of current events and ethical questions. I’ve hiked the 210-mile John Muir Trail several times, and I used my maps, trail notes, photographs, and John Muir’s historic descriptions of the High Sierra to document the experience in a large (72” H x 84” W) wall hanging.
Muir Trail Lakes, Peaks, and Passes, 72″ H X 84″ W
Heat transfers of Sierra maps, painted and embroidered with trail notes from backpacking trip, photographs on satin, silk, brocade and velvet, stitched. The borders are embroidered with John Muri’s descriptions of the high Sierra from the late 19th and early 20th century. Text of embroidery on borders link.
The works in my exhibition Another Glorious Sierra Day [at the Fresno Art Museum through June 27, 2021] relate to my wilderness experiences, Sierra history, science, and culture. I use explorers’ journals, maps, hiking photos, and glacier data in these works. A recurring Sierra theme is Yosemite glacier measurements. Transect pairs historical and recent melting data with 1800’s climbing and exploration journals.
How does your work comment on cultural and environmental issues? Can you walk us through a piece?
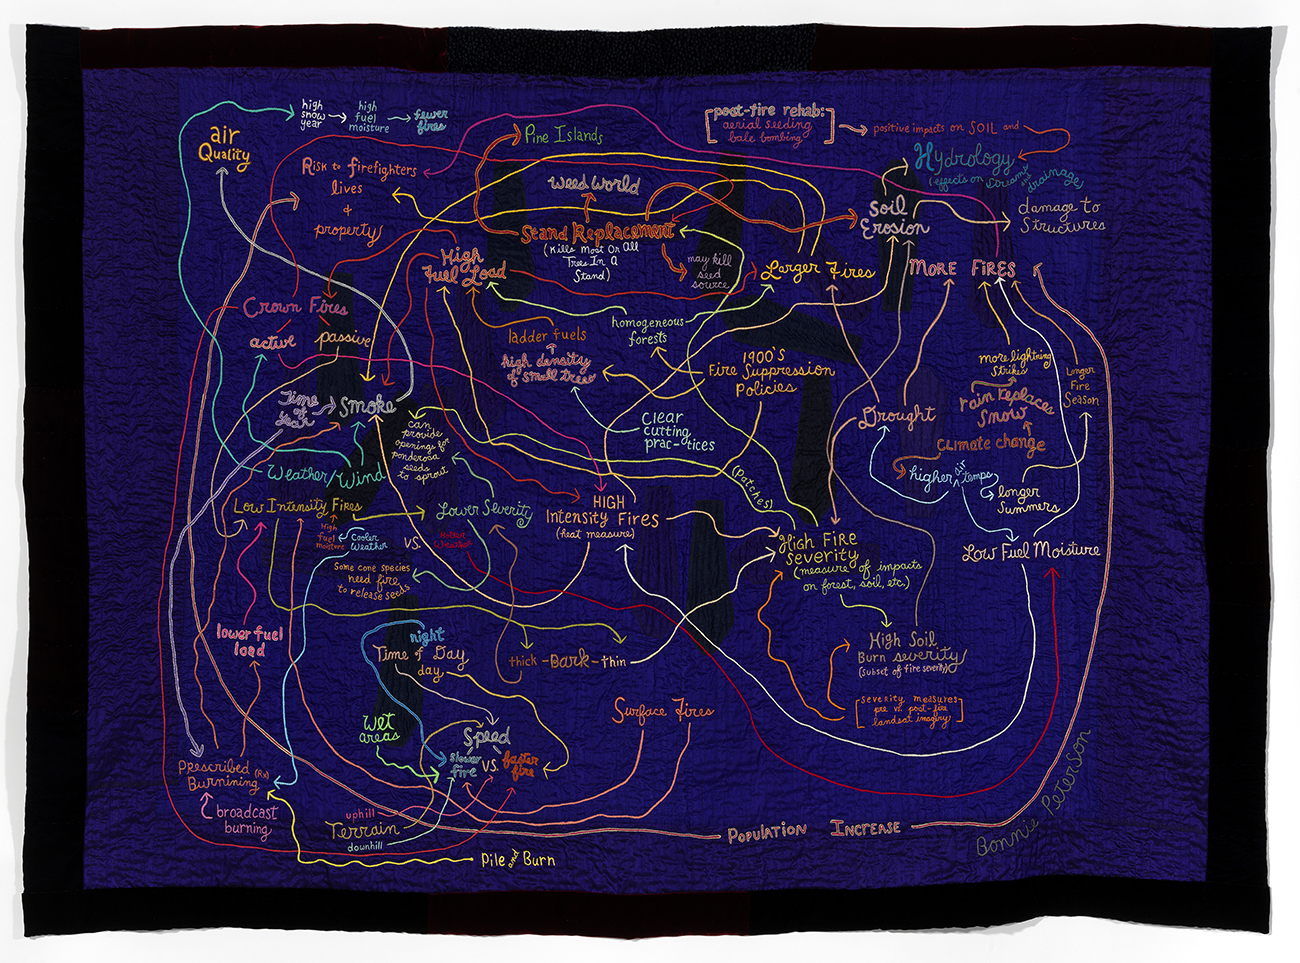
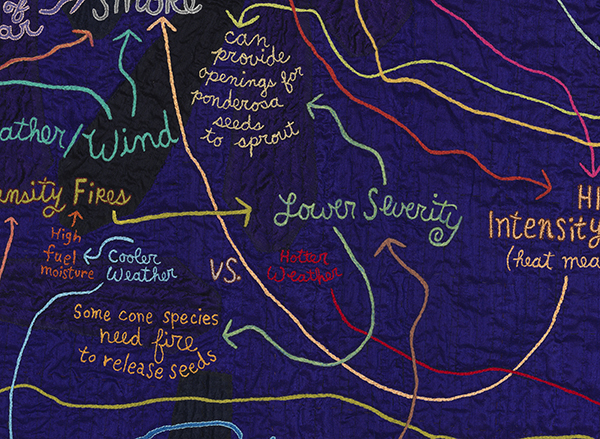
On the Nature of Fire (65” H x 85” W) is a good example. This project is a formal artist/scientist project organized by the Flagstaff Art Council with major funding from the NEA and the Joint Fire Science Program. Eleven artists attended field trips to the North Rim of the Grand Canyon and other locations in northern Arizona with fire managers and scientists to learn about fire ecology and climate science. The resulting art exhibitions were installed in Flagstaff, Tucson and Albuquerque. When I arrived home and started to think about executing artwork, I noticed my notes were filled with arrows indicating causality or other ecology relationships. I invested much time in further research on fire terminology and ecology. This piece developed over the following year as I developed a visual concept and started making compositional drawings. I refined and clarified my drawings using phone and emails with the experts over several development months. It was extremely satisfying to work with the research scientists and land managers who weigh alternatives and make fire suppression and prescribed burn decisions for the Grand Canyon. It was a fascinating learning experience.
On the Nature of Fire, 65″ H x 85″ W. Embroidery on silk, velvet.
Fires of Change: the art of fire science is an artist/scientist project that explores how fire as an ecosystem process is impacted by climate change and societal development. Photo Credit: Tom Van Eynde
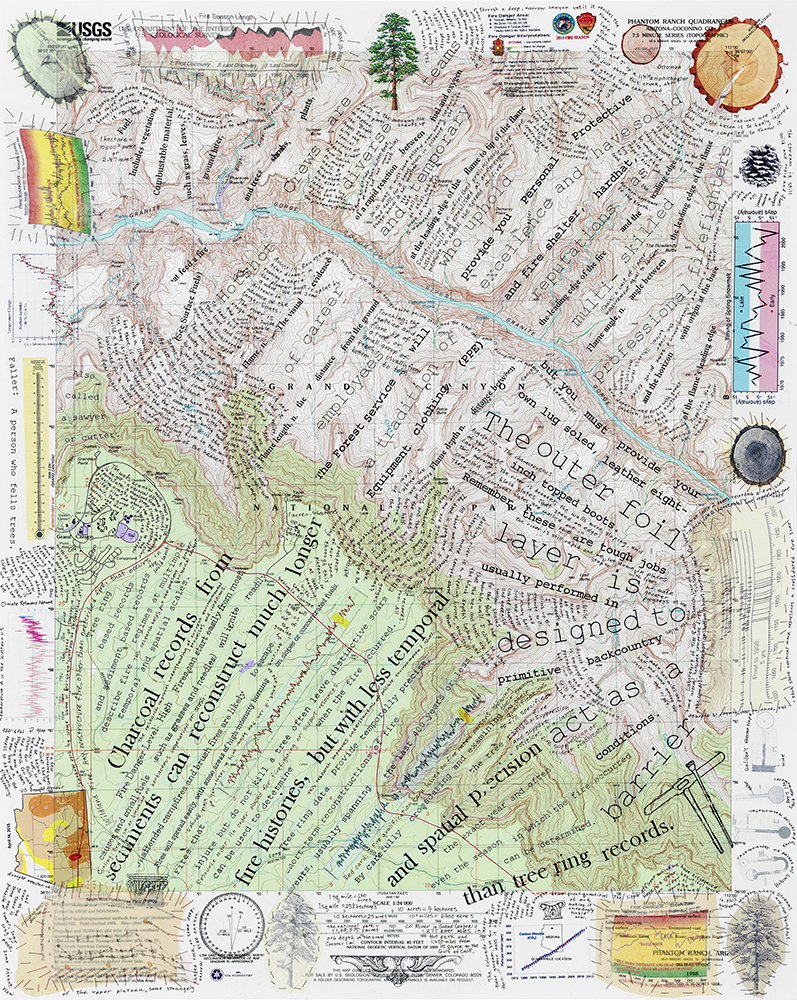
Wildland fire management involves many societal decisions, and I communicated some of these in two embellished topo maps of sections of the Grand Canyon. These maps are the background for cultural commentary on the working conditions and requirements for wildland firefighters, the details of ponderosa pine forest ecology, and also the history from early explorers of the Colorado River.
A short web page about my experience with the Fires of Change project is available here.
Phantom Ranch Quadrangle, 27″ H x 22″ W
Collage on paper; heat transfers, silk transfers, pen and stitching on a USGS, 7.5 minute topographic map.
The text contains fire terminology, the firefighter’s job description, information about their fire shelters, and fire history from tree ring research. Also text from John Wesley Powell’s Exploration of the Colorado River, 1895. Fires of Change: the art of fire science is an artist/scientist project that explores how fire as an ecosystem process is impacted by climate change and societal development. Fires of Change was funded by the National Endowment for the Arts and the Joint Fire Science Program and organized by the Flagstaff Arts Council.
Can you tell us about what you are currently working on?
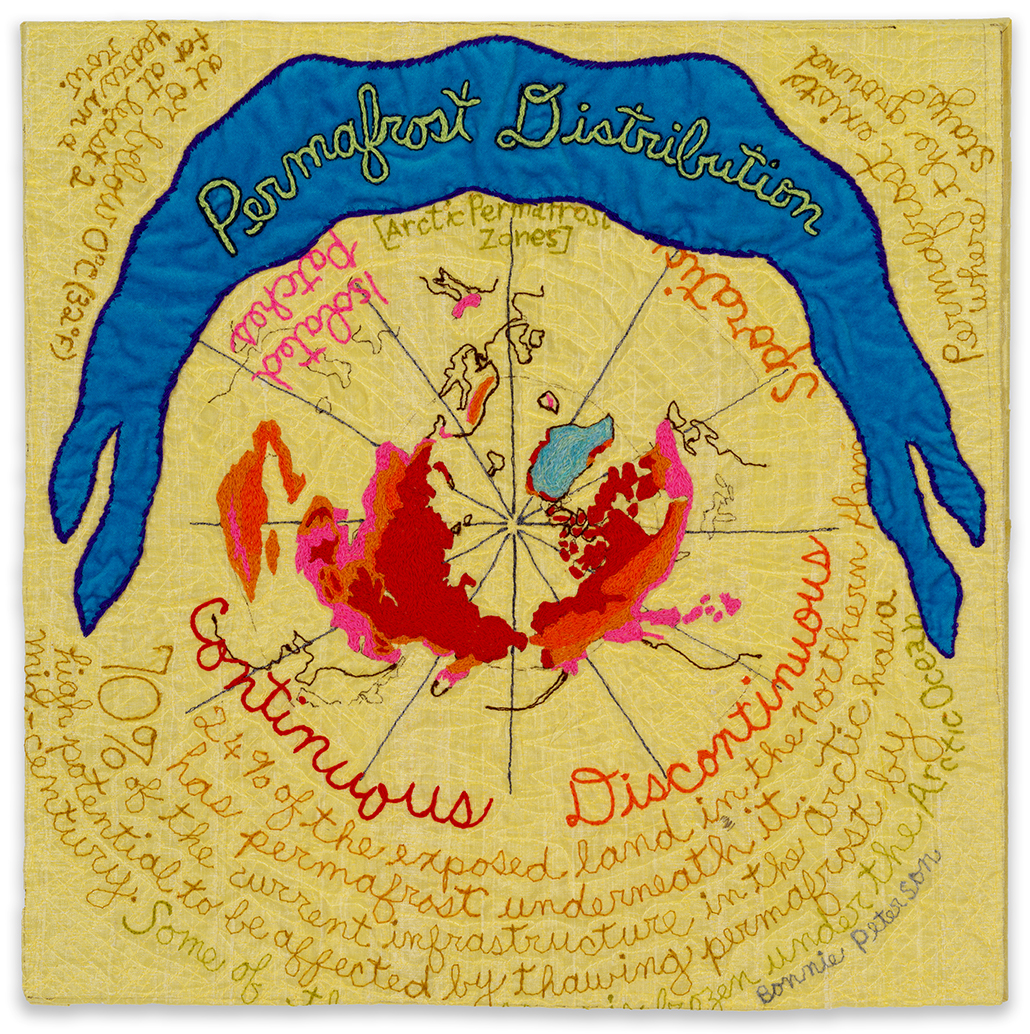
Permafrost! It’s a great research topic with many interesting variables and measurements. One aspect is the distribution of permafrost.
Insect apocalypse! Measurements of declines in insect populations are being approached in a variety of ways by scientists around the globe.
I’m working on these and a few other works for a show at the Peggy Notebaert Nature Museum in Chicago next year.
Permafrost Distribution, 16″ x 16″ x 1″ (41 x 41 x 3 cm)
Embroidery on silk shows the location of arctic permafrost and describes some of its characteristics.
Many Arctic communities and infrastructure sit on top of a thick layer of permafrost that has stabilized the ground for millennia. As global air temperatures rise, this frozen soil is melting, causing homes and roadways to crumble. Permafrost is defined as ground that is frozen year-round for a minimum of 2 years. It is made up of rock, soil, sediments and varying amounts of ice that bind the elements together. Permafrost covers about 24% of Earth’s exposed landmass in the northern hemisphere. This embroidery on silk shows a bird’s eye view of arctic permafrost and describes some of its characteristics. Darker shades of red indicate larger percentages of permanently frozen ground. Permafrost thawing also releases carbon dioxide and methane into the atmosphere, causing even greater atmospheric warming.
Where can we find your work?
- www.bonniepeterson.com
- Fresno Art Museum October 16, 2020 – June 27, 2021
- Peggy Notebaert Nature Museum, Chicago March, 2021- March 2022
- Instagram: writebon
All images copyright of the artist and used with their permission.
This November, Lifeology is challenging you to create your own piece of Data Visualization. Learn more about the challenge and prize.
